Profit & Loss Calendar: See Your Trading Year at a Glance
Most brokerage platforms bury your performance in endless tables and statements. Our color-coded Profit & Loss Calendar gives you a clear, visual summary of your trading results—month by month. Instantly spot your best and worst periods, identify patterns, and make smarter decisions based on real data, not just gut feel.
This simple, powerful view is missing from nearly every broker's platform. With our calendar, you get a true sense of your progress and can quickly see how changes in your strategy impact your results over time.
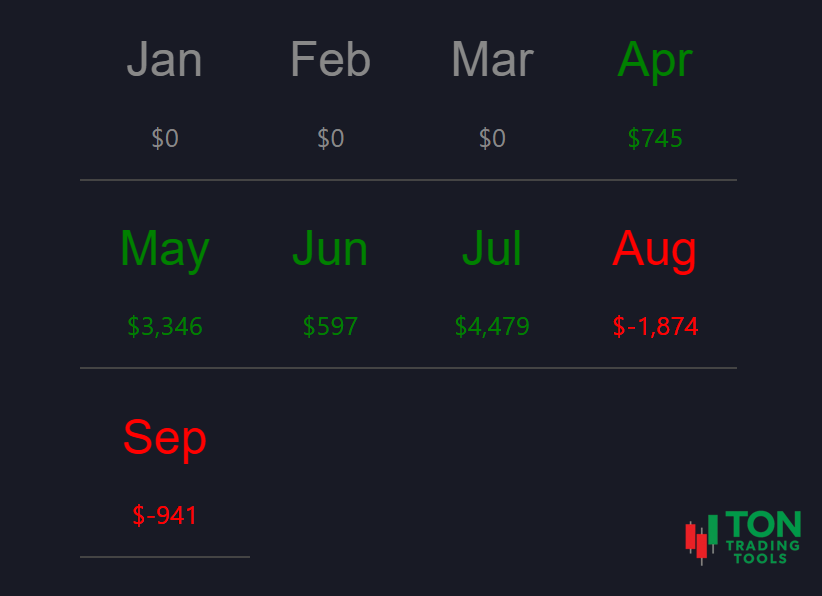
Each month is color-coded: green for profit, red for loss, gray for flat or missing data. This makes it easy to recognize trends, outliers, and consistency at a glance—no spreadsheet required.
Key Benefits
Instant Visual Feedback
- See your entire year’s P&L in one place
- Color-coded months for quick recognition of profit, loss, or flat performance
- Spot winning and losing streaks instantly
- Identify seasonal or strategy-based patterns
Better Decision Making
- Quickly review the impact of new strategies or changes in discipline
- Find out which months require more focus or adjustment
- Eliminate guesswork—base your review on clear, objective data
- Track your progress as a trader over time
Simple, Actionable Reporting
- No more digging through statements or spreadsheets
- Perfect for end-of-year reviews and tax preparation
- Works seamlessly with your trading journal
Designed for Real Traders
- Responsive design for desktop and mobile
- Integrates with your existing trading journal and reporting tools
- Built for day traders, swing traders, and investors alike
- Simple, intuitive interface—no learning curve
Why a Calendar View Matters
Traditional brokerage statements make it hard to see the big picture. Our calendar view brings your trading results to life, helping you understand not just what you made or lost, but when and how those results happened. This context is critical for improving your process and building consistency.
| What Brokers Show | What Our Calendar Provides |
|---|---|
| Endless tables and statements | Color-coded monthly performance at a glance |
| No visual feedback | Instant recognition of trends and outliers |
| Hard to spot patterns | Easy to identify winning/losing streaks |
| Manual data crunching | Automated, visual reporting |
Advanced Features
Our P&L Calendar is more than just a summary—it’s a tool for real improvement:
- Color-coded months for instant clarity
- Integrates with your trading journal for deeper analysis
- Responsive design for any device
- Simple, intuitive interface—no training required
Get Started Today
Stop guessing about your trading performance. Our Profit & Loss Calendar gives you the clarity you need to make better decisions, improve your process, and achieve your trading goals. Contact us to see how this simple tool can transform your review process.
FAQ
Frequently Asked Questions
Answers to common questions about the Profit & Loss Calendar.

It's a visual reporting tool that shows your monthly trading results in a color-coded calendar, making it easy to spot trends and review your performance.
By making it easy to see your best and worst months, you can quickly identify what’s working and what needs adjustment—helping you build consistency and confidence.
Yes, the calendar is perfect for annual reviews and tax preparation. You can screenshot your results for easy record-keeping.
Absolutely. The calendar integrates with your trading journal, making it easy to connect your notes and analysis with your monthly results.