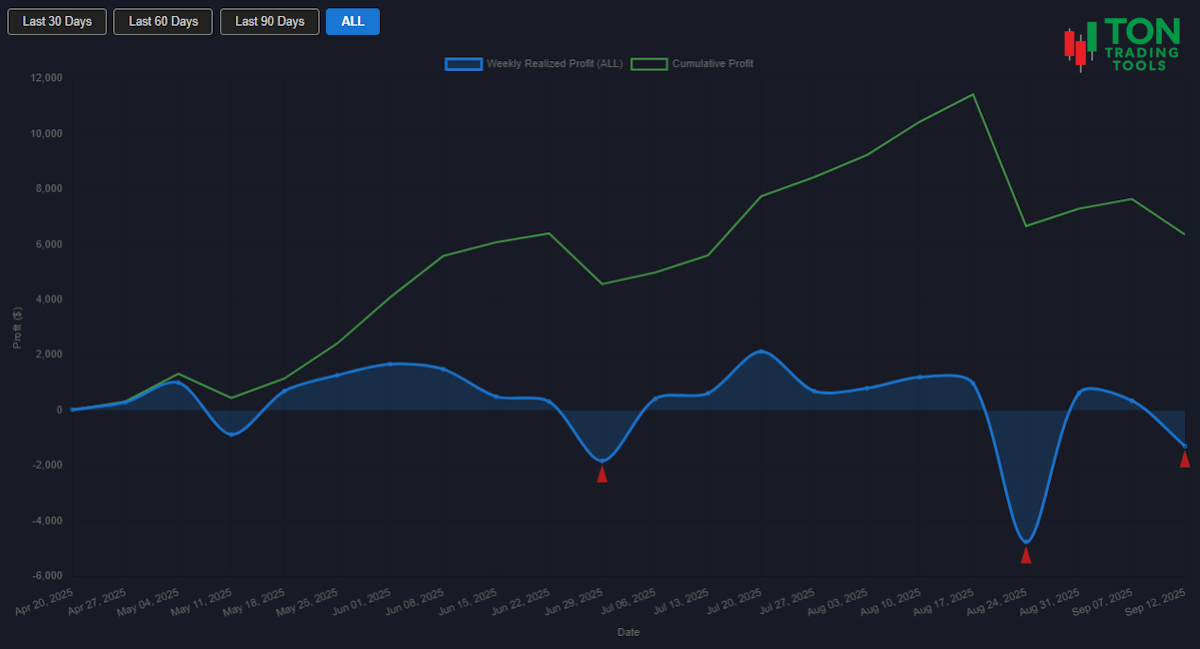
Cumulative vs Daily Profit Charts: See the Full Story
When it comes to day trading, a single chart rarely tells the whole story. That�s why Ton Trading Tools separates cumulative and daily profit charts giving you a more complete, actionable view of your trading performance. Here�s how each chart helps you make smarter decisions at the end of every trading day.
Instead of focusing on just one metric, our platform lets you analyze both your daily results and your long-term growth. This dual approach helps you spot patterns, manage risk, and build confidence in your trading process.
With automatic flagging of your highest and lowest profit days, interactive tooltips, and flexible range selection, you get the clarity you need to improve without the noise or confusion of a single, overloaded chart.
Key Benefits
Daily Profit Chart: Track Every Move
- See realized profit or loss for each trading day
- Spot winning and losing streaks at a glance
- Automatic flagging of your highest and lowest daily results
- Filter by 30, 60, 90 days, or view all data for flexible analysis
- Outlier days (large losses) are visually flagged for review
Cumulative Profit Chart: Visualize Your Growth
- Track your account's progress over time, smoothing out daily volatility
- Weekly grouping for long-term clarity when viewing all data
- See how daily results add up to long-term performance
- Compare cumulative and daily charts side-by-side for deeper insight
Advanced Features
- Interactive tooltips: hover to see exact profit values and dates
- Custom range selection: analyze recent or historical performance instantly
- Automatic outlier marking for large negative spikes
- Accessible, responsive design for any device
Why Not Just One Chart?
Combining all your data into a single chart can hide important details. Daily charts reveal the rhythm of your trading good days, bad days, and everything in between. Cumulative charts show your overall progress, helping you avoid overreacting to short-term swings. By separating these views, you get a more honest, actionable look at your trading habits and results.
| Single Chart Approach | Separate Cumulative & Daily Charts |
|---|---|
| Blends daily and long-term trends | Clear distinction between daily results and overall growth |
| Harder to spot outliers and patterns | Automatic flagging of highs, lows, and outliers |
| Limited context for performance review | Flexible range selection and weekly grouping for clarity |
| Can be visually overwhelming | Clean, focused charts for each perspective |
How to Use These Charts
- Use the range buttons to select your desired time frame
- Review daily profit bars to spot patterns and outliers
- Follow the cumulative line to understand your overall growth
- Pay attention to automatically flagged highs and lows for targeted review
- Leverage interactive tooltips for precise data points
Get Started Today
Stop guessing about your trading performance. With separate cumulative and daily profit charts, you get the full story so you can refine your strategy, manage risk, and trade with confidence. Experience the difference with Ton Trading Tools.
FAQ
Frequently Asked Questions
Answers to common questions about profit charting and performance analysis.

Viewing these charts separately gives you a clearer understanding of both your daily trading patterns and your long-term growth. It helps you spot trends, outliers, and areas for improvement that a single chart might hide.
The chart automatically highlights your highest and lowest daily profit points, as well as large negative spikes, so you can quickly identify critical days for review.
Yes, you can instantly switch between 30, 60, 90 days, or view all available data to analyze both short-term and long-term performance.
Absolutely. All charts are designed to be responsive and accessible on any device, so you can review your performance wherever you are.