Performance Snapshot Tiles: Your Trading Results, Visualized
Get a quick, actionable snapshot of your trading performance—daily, weekly, and monthly. The Performance Snapshot Tiles module gives you instant clarity on your profit/loss, number of trades, and instruments traded, all in a clean, animated dashboard. No more digging through spreadsheets or statements—see your results at a glance and make smarter decisions.
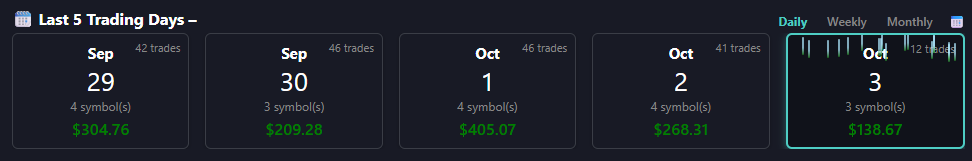
Each tile is color-coded and interactive, showing you the most important metrics for each period. Toggle between daily, weekly, and monthly views to spot trends, streaks, and outliers. Fun built-in animations spice up your reporting, making it easy to stay engaged and motivated as you review your progress.
Whether you’re tracking a winning streak, reviewing a tough week, or analyzing your monthly performance, these tiles help you focus on what matters most. Instantly see how many symbols you traded, your total profit or loss, and the number of trades for each period—all in one place.
Key Benefits
Instant Performance Overview
- See daily, weekly, and monthly results in a single dashboard
- Review profit/loss, number of trades, and instruments traded
- Spot winning and losing streaks at a glance
- Drill down to the details that matter for your process
Flexible, Fun Reporting
- Toggle between timeframes with a single click
- Animated tiles make reporting engaging and enjoyable
- Color-coded for instant recognition of performance
- Quickly review the impact of new strategies or discipline changes
Actionable, Simple Analytics
- No more manual data crunching or spreadsheet work
- Perfect for end-of-day, end-of-week, or end-of-month reviews
- Works seamlessly with your trading journal and reporting tools
Designed for Real Traders
- Responsive design for desktop and mobile
- Integrates with your existing trading journal and analytics
- Built for day traders, swing traders, and investors alike
- Simple, intuitive interface—no learning curve
Why Use Performance Snapshot Tiles?
Most trading platforms make it hard to see your true performance, especially across different timeframes. Our snapshot tiles bring your results to life, helping you understand not just what you made or lost, but how your trading evolves day by day, week by week, and month by month. This context is critical for improving your process and building consistency.
| What Brokers Show | What Our Tiles Provide |
|---|---|
| Endless tables and statements | Color-coded, animated performance tiles |
| No visual feedback | Instant recognition of daily, weekly, and monthly trends |
| Hard to spot patterns | Easy to identify streaks and outliers |
| Manual data crunching | Automated, visual reporting |
Advanced Features
The Performance Snapshot Tiles module is more than just a summary—it’s a tool for real improvement:
- Animated tiles for fun, engaging reporting
- Toggle between daily, weekly, and monthly views
- Color-coded for instant clarity
- Integrates with your trading journal and analytics
- Responsive design for any device
- Simple, intuitive interface—no training required
Get Started Today
Stop guessing about your trading performance. The Performance Snapshot Tiles give you the clarity and motivation you need to make better decisions, improve your process, and achieve your trading goals. Contact us to see how this simple tool can transform your review process.
FAQ
Frequently Asked Questions
Answers to common questions about the Performance Snapshot Tiles.

They’re interactive, animated tiles that show your daily, weekly, and monthly trading performance—making it easy to review profit/loss, trades, and symbols at a glance.
Fun animations highlight your biggest loss days and make reporting more engaging—so you actually look forward to reviewing your results.
Yes, you can toggle between timeframes with a single click—making it easy to analyze your performance across different periods.
Absolutely. The tiles integrate with your trading journal and analytics, making it easy to connect your notes and review your results.