Largest Intra-Day Position Analysis: Focus on What Moved Your Day
The Largest Intra-Day Position Analysis tool gives you a clear, visual way to review your most significant trades by quantity. Instantly see which price you bought the largest quantity, and how that position performed throughout the day.
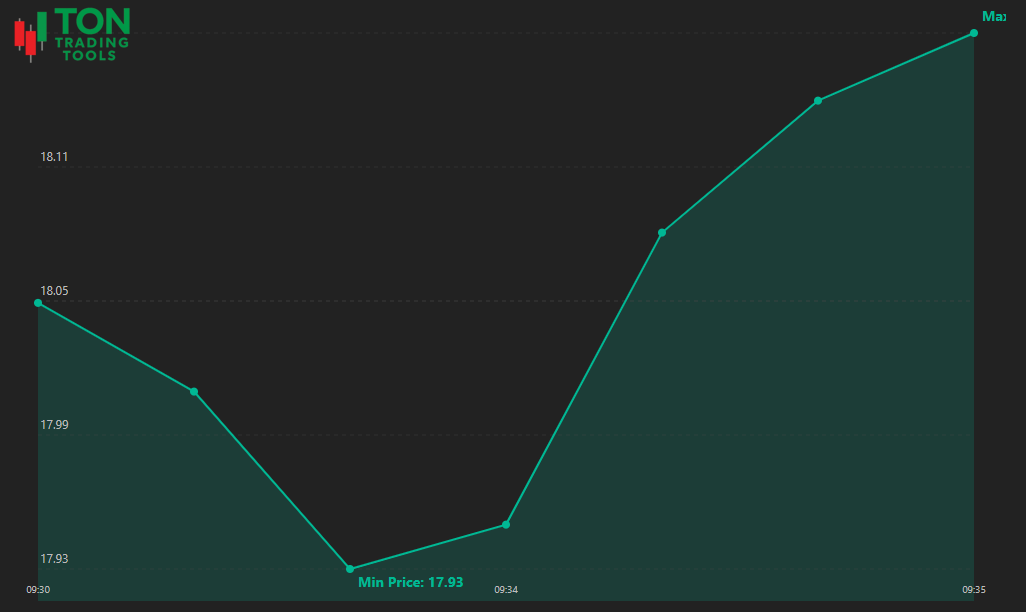
With a single click, switch between viewing price movements and running profit for your largest position. This module is designed for end-of-day reporting, helping you understand your trading decisions and refine your strategy.
The chart highlights only your largest intra-day position by quantity, so you can focus on the trades that truly impacted your results. All data is presented in a clean, centralized style for easy review and journaling.
Key Benefits
Pinpoint Your Most Impactful Entry
- See the exact price where you bought your largest quantity
- Visualize price movement and running profit for that trade
- Instantly identify which trades moved your P&L the most
Effortless Switching & Reporting
- Toggle between price and running profit views with one click
- Export your trade data to CSV for deeper analysis or record keeping
- Consistent, professional interface for all your day trading reports
Designed for End-of-Day Review
- All reporting is based on completed trading days�no real-time data
- Perfect for journaling, performance review, and strategy refinement
- Centralized styling for clarity and ease of use
Future Enhancements
- Largest dollar position filter�analyze your biggest trades by dollar value
- Peak trading time analysis�discover when you trade most actively
- Customizable chart overlays and additional filters
- Integration with your trading journal and reporting tools
Why Focus on Largest Quantity?
Most trading platforms bury your most important trades in endless logs. By focusing on your largest quantity position, you can quickly see which entries and exits had the biggest impact on your results. This clarity helps you improve your process and make smarter decisions.
| What Brokers Show | What Our Analysis Tool Provides |
|---|---|
| Long, confusing trade logs | Clear chart of your largest intra-day position by quantity |
| No easy way to see entry price for big trades | Instant entry price visualization for largest position |
| Manual profit tracking | Automatic running profit chart for your largest trade |
| No insight into peak trading times | Coming soon: peak trading time analysis and dollar position filter |
Advanced Features
The Largest Intra-Day Position Analysis tool is built for traders who want actionable insights:
- Toggle between price and running profit views
- Export-ready for your records and tax prep
- Centralized styling and responsive design
- Integration with your trading journal and reporting tools
- End-of-day reporting for accurate review
- Professional, intuitive interface
Get Started Today
Stop guessing about your most impactful trades. The Largest Intra-Day Position Analysis tool gives you the clarity you need to make better decisions, improve your process, and achieve your trading goals. Stay tuned for new features and enhancements designed to help you understand your trading patterns and maximize your results.
FAQ
Frequently Asked Questions
Answers to common questions about the Largest Intra-Day Position Analysis tool.

It�s a reporting tool that lets you analyze your largest intra-day positions by quantity, entry price, and running profit for each trade�making review and improvement fast and easy.
Yes, the tool highlights the exact entry price for your largest position, so you can review your strategy and timing.
Absolutely. You can toggle between price movement and running profit for your largest intra-day position with a single click.
Upcoming enhancements include largest dollar position filters, peak trading time analysis, and more customizable chart overlays.