Last Session Price
The price at which the equity closed during the last trading session.
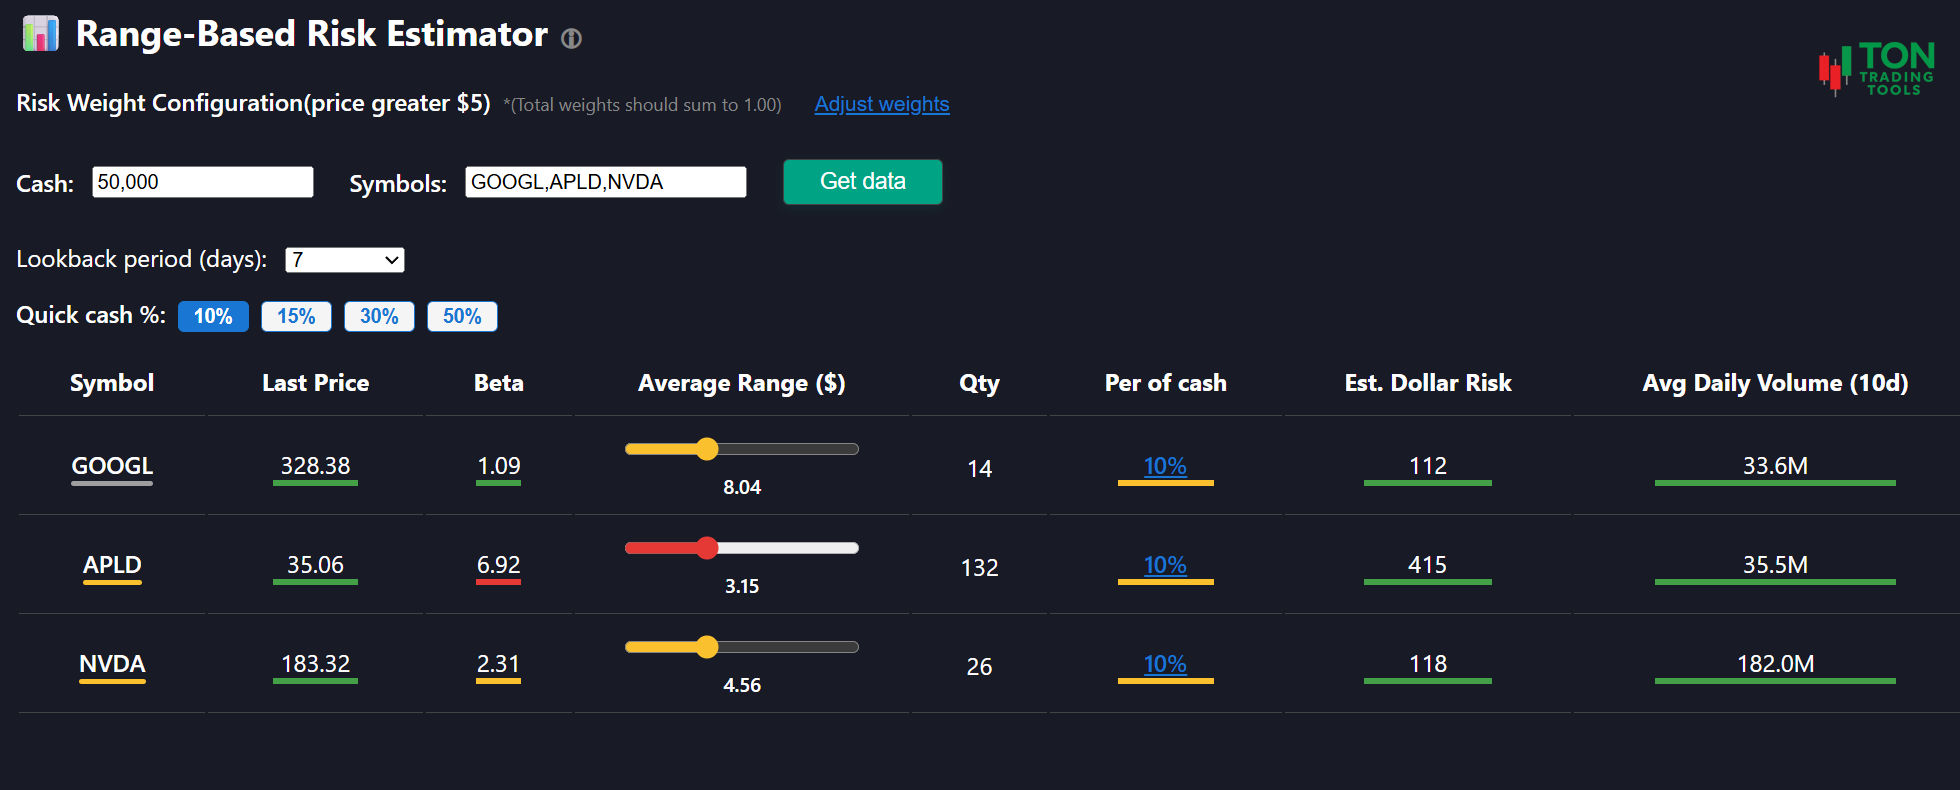
Take the guesswork out of risk management. The Volatility Calculator analyzes stocks based on fundamentals using real price ranges, volume, beta, and more giving you a clear, color-coded breakdown of risk for every symbol. Instantly see which positions are neutral, low, elevated, or high risk, and adjust your strategy for smarter day trading decisions.
Customize risk weights for stocks above $5 to match your personal risk tolerance. For penny stocks (under $5), the tool automatically applies stricter risk logic and highlights elevated risk levels, helping you avoid common pitfalls.
Click any symbol to view a detailed breakdown of the risk calculation, including how each factor contributes to the overall score. Use the interactive sliders to test different price ranges and see how your risk profile changes in real time.
| Without Volatility-Based Risk | With Volatility-Based Risk Calculator |
|---|---|
| Manual risk calculations and guesswork | Automated, color-coded risk breakdown for every symbol |
| Hard to spot elevated risk in penny stocks | Automatic stricter logic for low-priced stocks |
| Unclear position sizing and dollar risk | Clear estimates for position size and dollar risk |
| Generic risk models that ignore volume and beta | Volume, beta, and price all factor into your risk score |
Stop guessing about your risk exposure. With the Range-Based Risk Estimator, you'll have the insight you need to size positions intelligently, avoid common mistakes, and trade with confidence. Experience the power of personalized risk analytics with Ton Trading Tools.
Answers to common questions about the Range-Based Risk Estimator.

Penny stocks are low priced stocks with a last price under $5. They are considered higher risk, so they use a different weighting system.
At this time, weight customization is only available for stocks priced above $5.
Click on the symbol to view a detailed breakdown of the risk calculation.
N/A can appear for several reasons, but the most common is an invalid or unrecognized stock symbol. Double check the symbol, could it be an off exchange ticker?
This tool currently supports stocks only.
Treat the colors like a stop light. Gray is neutral risk. Green signifies low risk, yellow means caution, orange is elevated risk, and red is high risk.
No, all calculations are based on historical data. Use this tool as a starting point when planning your trades.
No, the Range-Based Risk Estimator is designed for stocks only at this time.
The price at which the equity closed during the last trading session.
A measure of a stock's volatility compared to the overall market. A beta above 1 indicates the stock is more volatile than the market, while a beta below 1 indicates less volatility.
The average price range over a specific date range (high minus low closing price). For penny stocks (under $5), the largest range from either the 7-day, 30-day, or 90-day period is used to estimate potential price movement.
The largest number of shares you can purchase with your current equity.
The estimated dollar amount at risk if the equity moves the full amount of the average range. For stocks below $5, the largest range from either the 7-day, 30-day, or 90-day period is used. This conservative estimate accounts for the potential of these stocks to jump 100% without news.
Indicates a low-priced stock (last price under $5) using penny stock risk thresholds and weights.
The average daily volume reflects how liquid a stock is—how many shares are traded on a typical day. Higher liquidity means orders fill quickly with less slippage, allowing you to enter and exit positions closer to the expected price. Low volume can lead to wider spreads and higher costs due to thinner order books.
© 2026 Ton Trading Tools