Range-Based Risk Estimator: Smarter Position Sizing
Take the guesswork out of risk management. The Range-Based Risk Estimator analyzes stocks based on fundamentals using real price ranges, volume, beta, and more giving you a clear, color-coded breakdown of risk for every symbol. Instantly see which positions are neutral, low, elevated, or high risk, and adjust your strategy for smarter day trading decisions.
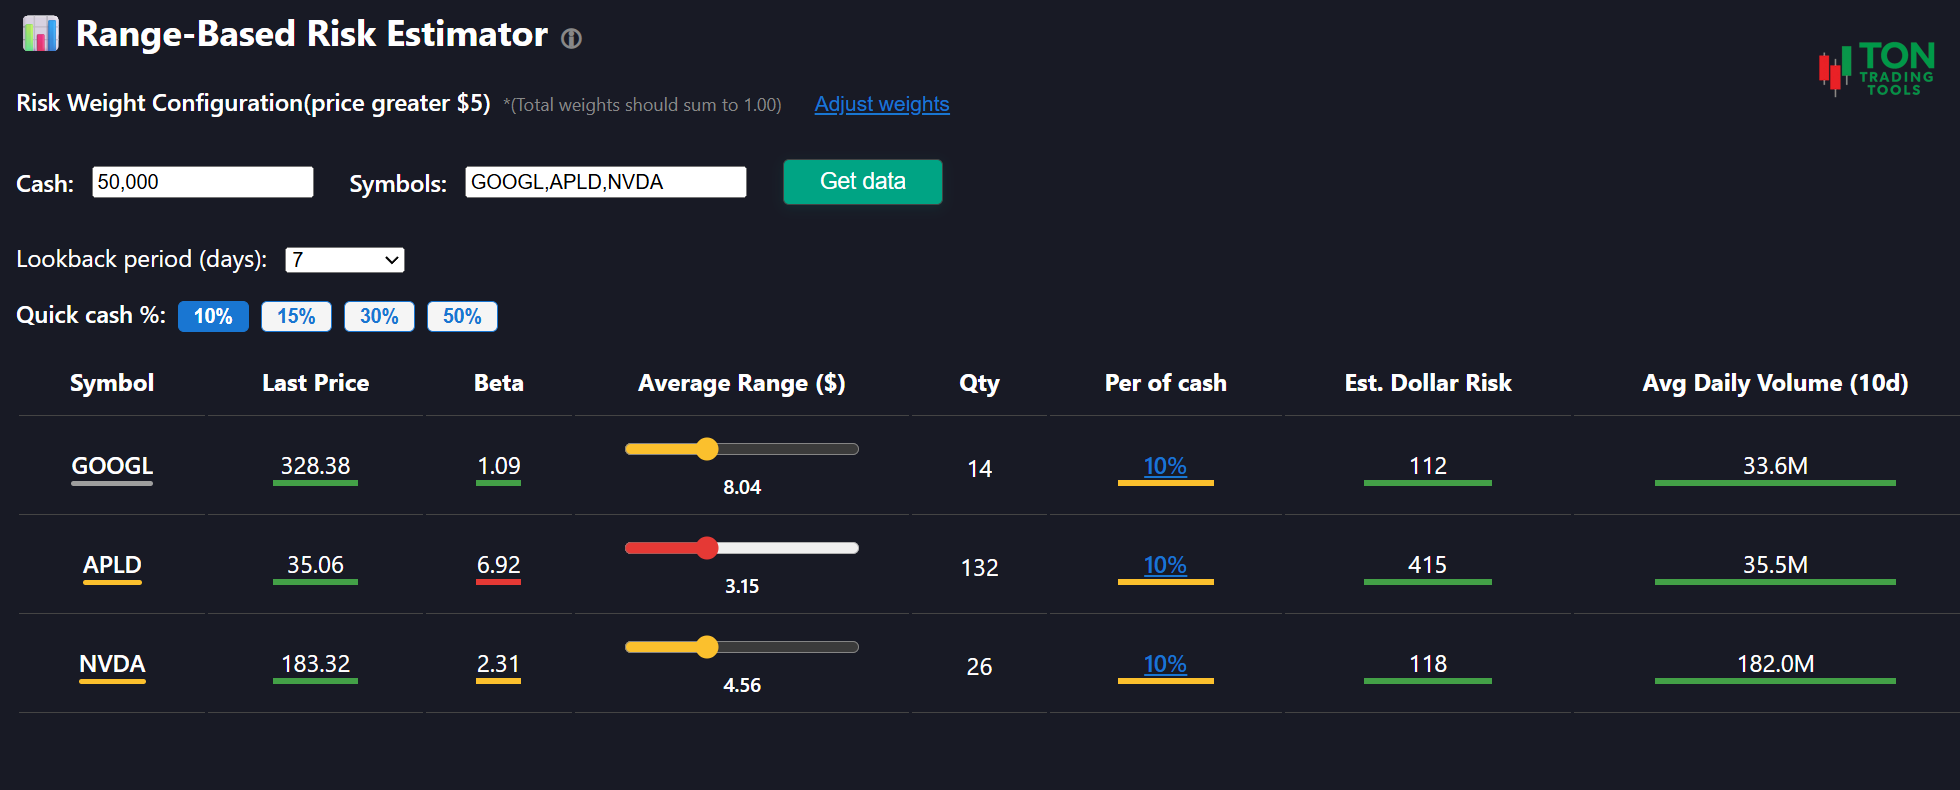
Customize risk weights for stocks above $5 to match your personal risk tolerance. For penny stocks (under $5), the tool automatically applies stricter risk logic and highlights elevated risk levels, helping you avoid common pitfalls.
Click any symbol to view a detailed breakdown of the risk calculation, including how each factor contributes to the overall score. Use the interactive sliders to test different price ranges and see how your risk profile changes in real time.
Key Benefits
Visualize Risk Instantly
- Color-coded risk levels for every stock position
- Stoplight colors: gray (neutral), green (low), yellow (caution), orange (elevated), red (high risk)
- See risk at a glance for all symbols in your portfolio
- Detailed breakdown available for every symbol
Customizable & Adaptive
- Adjust risk weights for stocks above $5 to fit your strategy
- Penny stocks use stricter, pre-set risk logic for added safety
- Interactive sliders let you test different price ranges
- Instant feedback as you adjust inputs
Actionable Insights for Day Traders
- Estimate position size and dollar risk for any stock
- See how volume, beta, and price affect your risk score
- Quick cash % buttons for fast scenario analysis
- All calculations are end-of-day�no real-time data required
Why Use a Range-Based Risk Estimator?
Day trading is all about managing risk. By analyzing real price ranges, volume, and volatility, you can size your positions more intelligently and avoid outsized losses. The Range-Based Risk Estimator gives you the tools to build better habits, avoid overexposure, and trade with confidence�especially when dealing with volatile penny stocks.
| Without Range-Based Risk | With Range-Based Risk Estimator |
|---|---|
| Manual risk calculations and guesswork | Automated, color-coded risk breakdown for every symbol |
| Hard to spot elevated risk in penny stocks | Automatic stricter logic for low-priced stocks |
| Unclear position sizing and dollar risk | Clear estimates for position size and dollar risk |
| Generic risk models that ignore volume and beta | Volume, beta, and price all factor into your risk score |
How to Use This Tool
- Enter your stock symbols and account balance
- Select your lookback period for price range analysis
- Adjust risk weights for stocks above $5 as needed
- Click any symbol for a detailed risk breakdown
- Use sliders and quick cash % buttons to test scenarios
- Review color-coded risk levels and breakdowns before trading
Get Started Today
Stop guessing about your risk exposure. With the Range-Based Risk Estimator, you�ll have the insight you need to size positions intelligently, avoid common mistakes, and trade with confidence. Experience the power of personalized risk analytics with Ton Trading Tools.
FAQ
Frequently Asked Questions
Answers to common questions about the Range-Based Risk Estimator.

Penny stocks are low priced stocks with a last price under $5. They are considered higher risk, so they use a different weighting system.
At this time, weight customization is only available for stocks priced above $5.
Click on the symbol to view a detailed breakdown of the risk calculation.
N/A can appear for several reasons, but the most common is an invalid or unrecognized stock symbol. Double check the symbol�could it be an off exchange ticker?
This tool currently supports stocks only.
Treat the colors like a stop light. Gray is neutral risk. Green signifies low risk, yellow means caution, orange is elevated risk, and red is high risk.
No, all calculations are based on historical data. Use this tool as a starting point when planning your trades.
No, the Range-Based Risk Estimator is designed for stocks only at this time.