Today’s Trade Table: Your End-of-Day Recap
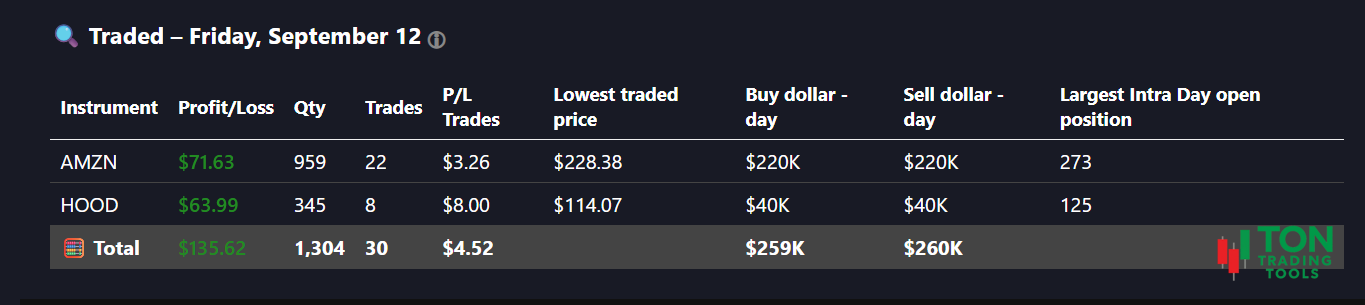
The Today Trade Table gives you a clear, actionable summary of your trading day. Instantly see your profit and loss by symbol, the number of trades, total quantity bought, and the largest position you held. If you opened and closed a position in the same day, your numbers will match your brokerage statement—making reconciliation and review simple.
This simple daily performance view is something most brokerage platforms—including Thinkorswim—only provide during the current trading day. After the market closes, it becomes difficult or nearly impossible to locate a concise summary of your results. On Thinkorswim, for example, you must sift through a lengthy list of individual trades or export and decipher complex Excel reports just to reconstruct your daily performance.
The Today Trade Table solves this problem by providing a clear, at-a-glance snapshot of your entire day’s trading activity. No more digging, no more spreadsheets—just a fast, focused recap of what mattered most.
This table is designed for day traders and active investors who want to quickly review their most impactful trades, spot which symbols drove their results, and understand their risk in both share quantity and dollar terms. No more digging through broker statements or spreadsheets—get the full picture in seconds.
Key Benefits
Complete Daily Recap
- See all trades for the day, grouped by symbol
- Instantly view profit and loss for each instrument
- Match your broker’s numbers for same-day round trips
- Spot your most and least profitable trades at a glance
Risk & Position Analysis
- Review your largest intra-day position by quantity and dollar value
- Gauge risk not just by shares, but by total dollar exposure
- See buy and sell dollar amounts for the day
- Identify outsized trades that may need review
Actionable, Simple Reporting
- Sort by profit, loss, or symbol to focus on what matters
- Export or screenshot your table for easy record-keeping
- Perfect for end-of-day reviews and tax preparation
- Works seamlessly with your trading journal
Flexible Date Ranges
- Toggle between today, last 30 days, 90 days, or year-to-date (YTD)
- Quickly review performance over any period
- Spot trends and outliers across different timeframes
- Drill down to the trades that made the biggest impact
Why This Table Matters
Most brokerage platforms make it difficult to get a true end-of-day summary, especially if you’re trading multiple symbols or strategies. The Today Trade Table brings all your key metrics together in one place, so you can focus on improvement—not data entry.
| What Brokers Show | What Our Table Provides |
|---|---|
| Raw trade logs | Summarized profit/loss by symbol |
| Endless statements | Clear, sortable daily recap |
| No risk context | Largest position and dollar risk shown |
| Manual reconciliation | Matches broker numbers for same-day trades |
Advanced Features
The Today Trade Table is more than just a summary—it’s a tool for real improvement:
- Color-coded profit and loss for instant recognition
- Sortable columns for fast review
- Dollar and share-based risk metrics
- Export-ready for your records or tax prep
- Integrates with your trading journal and other reporting tools
Get Started Today
Stop guessing about your daily trading results. The Today Trade Table gives you the clarity you need to make better decisions, improve your process, and achieve your trading goals. Contact us to see how this simple tool can transform your end-of-day review.
FAQ
Frequently Asked Questions
Answers to common questions about the Today Trade Table.

It’s a reporting tool that summarizes your daily trades, profit and loss by symbol, and largest positions—making end-of-day review fast and easy.
Yes, if you opened and closed a position in the same day, your profit and loss should match your broker’s statement for that symbol.
Absolutely. The table shows your largest intra-day position by quantity and the corresponding dollar amount, so you can gauge your risk from multiple angles.
Yes, you can toggle between today, the last 30 days, 90 days, or year-to-date to review your trading performance over any period.