Largest Position Comparison: See What Really Moved Your P&L
The Largest Position Comparison tool gives you a powerful, visual way to analyze your biggest trades and risk across any date range. Instantly compare your largest positions by quantity, dollar amount, and profit/loss for any two days, week ranges, or custom periods.
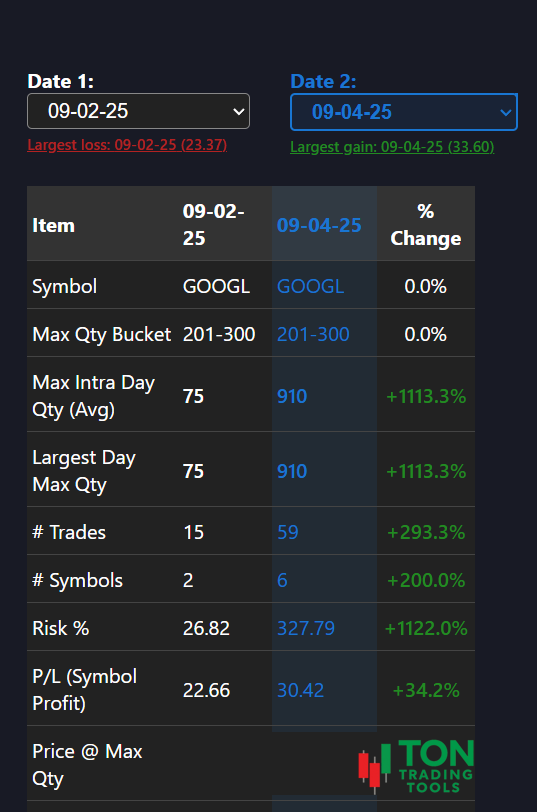
This module automatically flags your largest loss and largest gain, so you can quickly spot outliers and review what drove your best and worst days. Toggle between total daily profit and the largest quantity position for each day to see which trades had the biggest impact on your results.
Go deeper by analyzing your performance by price bucket�see if you trade better with lower-priced stocks or higher dollar ranges. Compare risk as a percentage of your account balance, and see how many symbols you traded on each date. With flexible date ranges (30 days, 90 days, year-to-date), you can review your trading from any angle.
Key Benefits
Granular Position & Risk Analysis
- Compare your largest positions by quantity and dollar value across any two dates or ranges
- Instantly flag and review your biggest win and loss days
- Analyze by price bucket to see where you perform best
- See risk as a percentage of your account balance
- Track how many symbols you traded each day
Flexible, Powerful Comparison
- Toggle between daily profit and largest position for each day
- Compare any two days, last 30, 90, or YTD
- Review by week, month, or custom range
- See percent change in key metrics between periods
Actionable, Simple Reporting
- Color-coded profit/loss and percent change for instant clarity
- Hide or show rows to focus on what matters
- Export or screenshot your comparison for easy sharing or review
- Perfect for end-of-month or end-of-quarter reviews
Designed for Real Traders
- Responsive design for desktop and mobile
- Integrates with your trading journal and reporting tools
- Built for day traders, swing traders, and investors alike
- Simple, intuitive interface�no learning curve
Why Compare Your Largest Positions?
Most trading platforms make it difficult to see which trades or positions truly moved your P&L, especially across different days or strategies. This tool brings your most important metrics together, so you can focus on what�s working, spot risk, and improve your process.
| What Brokers Show | What Our Comparison Tool Provides |
|---|---|
| Endless trade logs and statements | Clear, side-by-side comparison of your largest positions |
| No easy way to flag biggest wins/losses | Automatic flagging of largest gain and loss |
| Hard to analyze by price or risk | Performance by price bucket and risk % of account |
| Manual data crunching | Automated, visual reporting with flexible date ranges |
Advanced Features
The Largest Position Comparison tool is more than just a summary�it�s a tool for real improvement:
- Automatic flagging of largest win/loss for fast review
- Toggle between daily profit and largest position
- Analyze by price bucket, risk %, and symbol count
- Flexible date ranges: today, 30 days, 90 days, YTD, or custom
- Export-ready for your records or tax prep
- Integrates with your trading journal and other reporting tools
Get Started Today
Stop guessing about your biggest trades and risk. The Largest Position Comparison tool gives you the clarity you need to make better decisions, improve your process, and achieve your trading goals. Contact us to see how this simple tool can transform your review process.
FAQ
Frequently Asked Questions
Answers to common questions about the Largest Position Comparison tool.

It�s a reporting tool that lets you compare your largest positions, profit/loss, and risk across any two days or date ranges�making review and improvement fast and easy.
Yes, the tool automatically flags your largest gain and loss so you can review them instantly.
Absolutely. You can break down your performance by price bucket and see risk as a percentage of your account balance.
Yes, you can compare any two days, last 30 or 90 days, year-to-date, or custom ranges for a complete performance review.