Low-Price Stock Pattern: Know Your Trading Tendencies
The Low-Price Stock Pattern tool is designed for Thinkorswim desktop users who want to understand their real trading behavior. Are you consistently drawn to stocks under $5? This tool analyzes your trade history to reveal if you have a preference for low-priced stocks, helping you spot both emerging and established patterns in your trading.
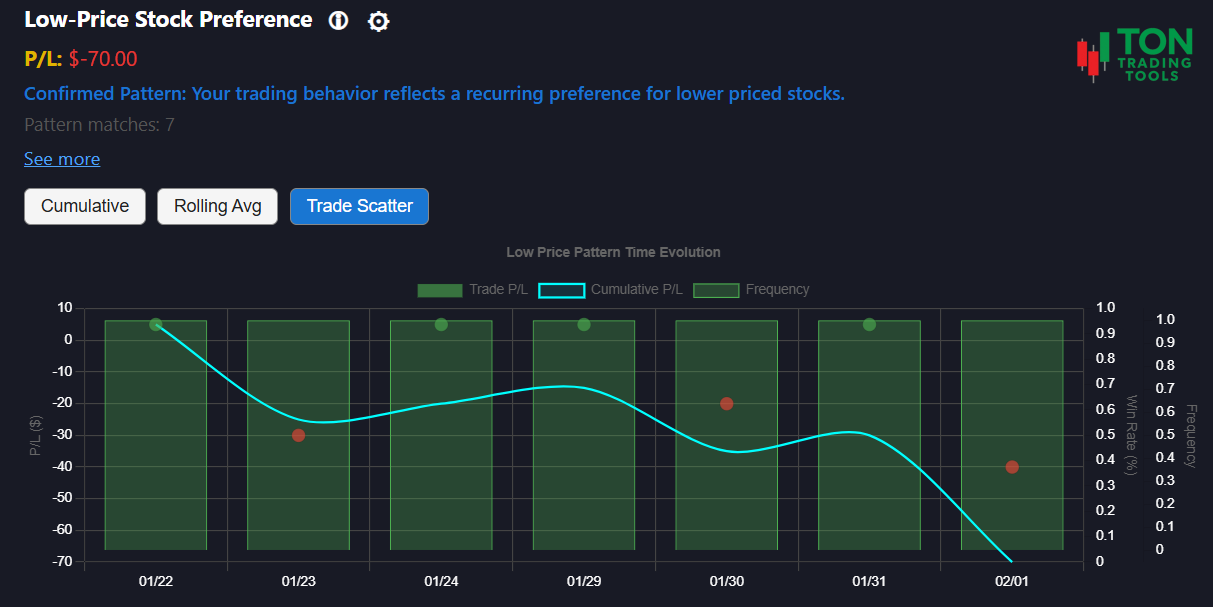
This is not a chart analysis tool. Instead, it focuses on your actual trading decisions�days when your trades were primarily placed in stocks below your defined price threshold. Use this insight to improve your discipline, manage risk, and avoid common pitfalls associated with low-priced stocks.
For a deeper understanding of risk, try our Volatility Based Risk Calculator, which is especially useful for evaluating the risk profile of low-priced stocks.
How Pattern Comparison Works
Pattern Detection
- Identifies days when your trades focus on stocks below $5.00
- Tracks your activity over a 90-day lookback window
- Classifies your pattern as Emerging, Confirmed, or Strong
Pattern Strength
- Emerging Pattern: 3+ days of low-price stock focus
- Confirmed Pattern: 10+ days of low-price stock focus
- Strong Pattern: 15+ days of low-price stock focus
Why It Matters
- Low-priced stocks can carry unique risks and volatility
- Recognizing your preference helps you manage risk and improve results
- Combine with Volatility Based Risk Calculator for a complete risk profile
Supported Patterns & Related Tools
Get Started Today
Ready to see if you have a low-price stock bias? Upload your Thinkorswim desktop trade files and let the Low-Price Stock Pattern tool do the rest. For best results, review your patterns at the end of each trading day.
FAQ
Frequently Asked Questions
Answers to common questions about the Low-Price Stock Pattern tool for Thinkorswim desktop.

This tool analyzes your Thinkorswim desktop trade history to detect days when you focused on stocks under $5.00, helping you spot and manage a low-price stock preference.
No, this is not a chart analysis tool. It focuses on your actual trading decisions and patterns, not technical chart setups.
The Low-Price Stock Pattern tool is currently available only for Thinkorswim desktop users.
Low-priced stocks can be volatile and risky. Use this tool alongside the Volatility Based Risk Calculator to better understand and manage your exposure.