Concentration Bias Pattern: Manage Your Position Sizing
The Concentration Bias Pattern tool is built for Thinkorswim desktop users who want to understand and control their risk. Are you putting too much of your available cash into a single trade? This tool analyzes your trade history to reveal when your open intraday positions exceed a set percentage of your available cash, helping you spot both emerging and established concentration bias in your trading.
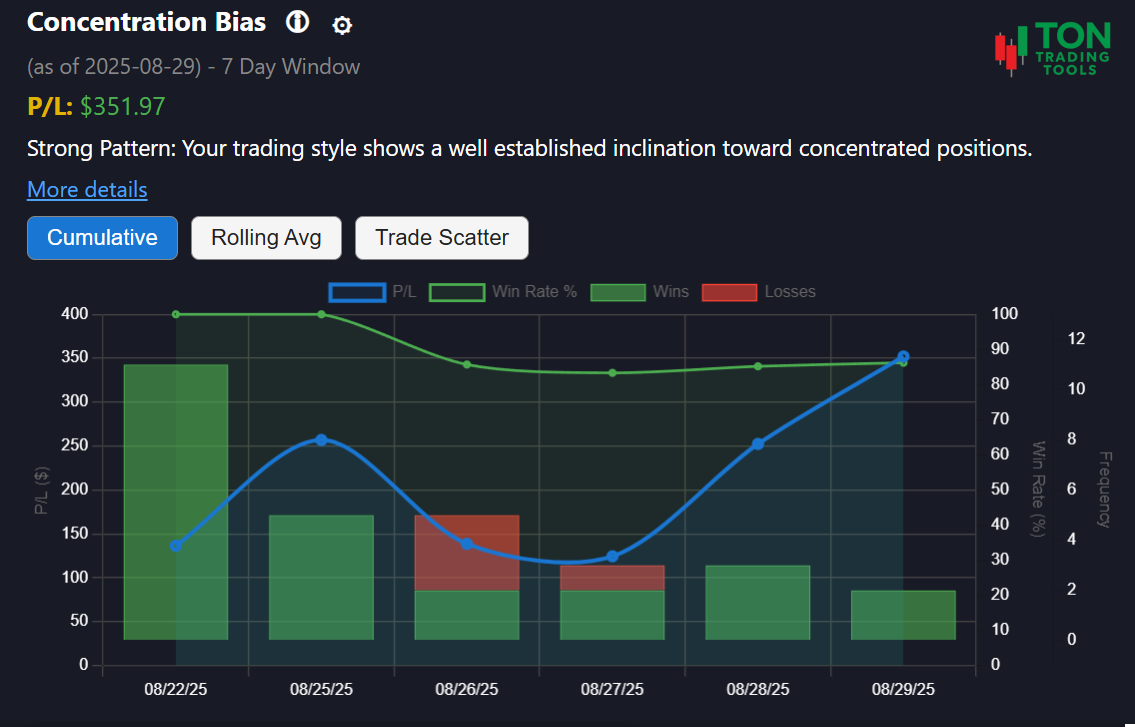
This is not a chart analysis tool. Instead, it focuses on your actual position sizing and risk allocation—tagging days when your position size crosses a customizable cash threshold (default: 24%). Use this insight to improve your discipline, diversify your trades, and avoid the dangers of over-concentration.
For a deeper understanding of risk, try our Volatility-Based Risk Calculator, which is especially useful for evaluating the risk profile of concentrated positions and low-priced stocks.
How Pattern Comparison Works
Pattern Detection
- Identifies days when your open position exceeded 24% of your available cash
- Tracks your activity over a 90-day lookback window
- Tags only the trades that contributed to the concentration event
Pattern Strength
- Emerging Pattern: 5+ days of concentration bias
- Confirmed Pattern: 10+ days of concentration bias
- Strong Pattern: 15+ days of concentration bias
Why It Matters
- Concentrated positions can lead to outsized risk and volatility
- Recognizing your bias helps you diversify and manage risk
- Combine with Volatility Based Risk Calculator for a complete risk profile
Supported Patterns & Related Tools
- Concentration Bias (this page)
- Low-Price Stock Preference
- Volatility Based Risk Calculator
- Pattern Comparison Overview
Get Started Today
Ready to see if you have a concentration bias? Upload your Thinkorswim desktop trade files and let the Concentration Bias Pattern tool do the rest. For best results, review your patterns at the end of each trading day.
FAQ
Frequently Asked Questions
Answers to common questions about the Concentration Bias Pattern tool for Thinkorswim desktop.

This tool analyzes your Thinkorswim desktop trade history to detect days when your open position exceeded a set percentage of your available cash, helping you spot and manage concentration bias.
No, this is not a chart analysis tool. It focuses on your actual position sizing and risk allocation, not technical chart setups.
The Concentration Bias Pattern tool is currently available only for Thinkorswim desktop users.
Concentrated positions can expose you to outsized risk. Use this tool alongside the Volatility Based Risk Calculator to better understand and manage your exposure.