Overtrading Pattern: Identify and Control Excessive Trading
The Overtrading Pattern tool is designed for Thinkorswim desktop users who want to understand and address their trading frequency. Are you placing too many trades in a single day or over a short period? This tool analyzes your trade history to reveal if you have a tendency to overtrade, helping you spot both emerging and established patterns in your behavior.
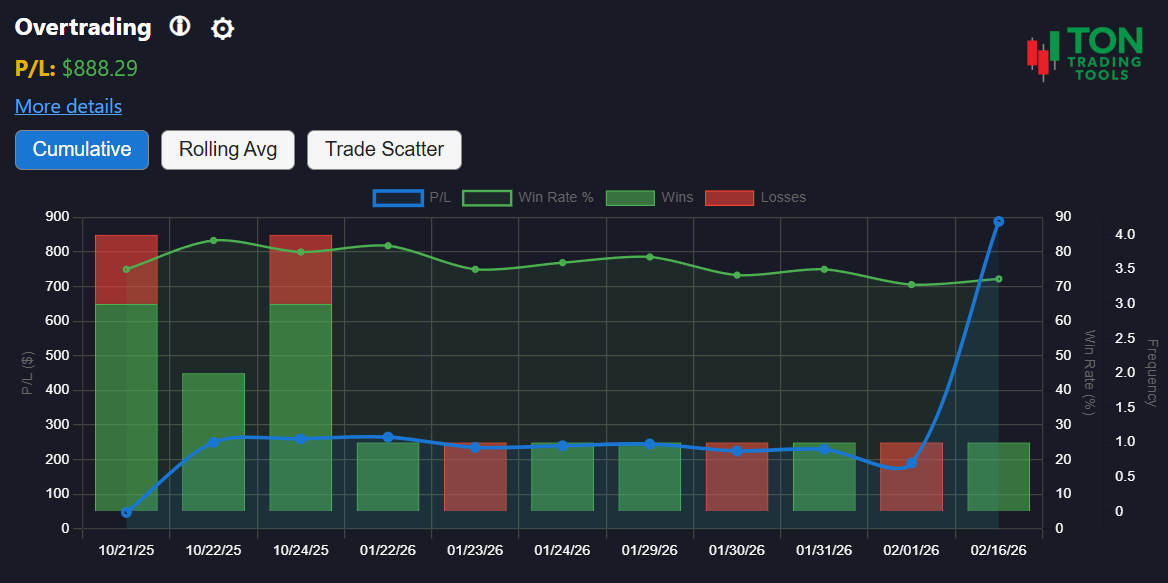
This is not a technical charting tool. Instead, it focuses on your actual trading decisions�days when your trade count exceeds a healthy threshold. Use this insight to improve your discipline, manage risk, and avoid the common pitfalls of overtrading.
For a deeper understanding of your trading discipline, try our Scalping Behavior Pattern and Volatility Based Risk Calculator.
How Overtrading Pattern Detection Works
Pattern Detection
- Identifies days when your trade count exceeds a set threshold (e.g., 20+ trades)
- Tracks your activity over a 30-day lookback window
- Classifies your pattern as Emerging, Confirmed, or Strong
Pattern Strength
- Emerging Pattern: 3+ days of overtrading
- Confirmed Pattern: 10+ days of overtrading
- Strong Pattern: 15+ days of overtrading
Why It Matters
- Overtrading can lead to higher costs, emotional fatigue, and poor decision-making
- Recognizing your pattern helps you regain control and improve results
- Combine with Volatility Based Risk Calculator for a complete risk profile
Supported Patterns & Related Tools
- Overtrading Pattern (this page)
- Scalping Behavior Pattern
- Volatility Based Risk Calculator
- Pattern Comparison Overview
Get Started Today
Ready to see if you have an overtrading habit? Upload your Thinkorswim desktop trade files and let the Overtrading Pattern tool analyze your trading history. For best results, review your patterns at the end of each trading day.
FAQ
Frequently Asked Questions
Answers to common questions about the Overtrading Pattern tool for Thinkorswim desktop.

This tool analyzes your Thinkorswim desktop trade history to detect days when your trade count exceeds a healthy threshold, helping you spot and address overtrading habits.
Overtrading is flagged when your trade count for a day exceeds a set threshold (e.g., 20+ trades). The tool reviews your trade history over a 30-day window to identify patterns.
Overtrading can lead to higher commissions, emotional exhaustion, and poor decision-making. Recognizing this pattern helps you regain control and improve your trading results.
The Overtrading Pattern tool is currently available only for Thinkorswim desktop users.